available 24/7
Free Consultation

Posted on March 16, 2022 in Car Accident,Drunk Driving,DUI
Some motor vehicle crashes and collisions are unfortunately not preventable, even when drivers exercise due caution and drive defensively. Undetectable road or weather conditions, the actions of other drivers, and mechanical failures can cause sudden and unexpected problems. However, many crashes can be avoided, particularly those where one or more motorist is driving under the influence (DUI).
To immediately jump to the resources at any point on this page, please click the appropriate link below.
What is DUI in Arizona?
What Factors Caused or Influenced Arizona Car Crashes in 2020?
DUI Motorcycle Accidents in Arizona
Tracking Alcohol-Related Crashes from 2016-2020
Alcohol-Related Crashes by Vehicle Type
What Were the Damages of Alcohol-Related Crashes in 2020?
Alcohol-Related Crashes by Arizona County
Arizona DUI Task Force Statistics, 2015-2020 (Holidays)
Annual Arizona DUI Task Force Statistics, 2015-2019
How Much Does the Arizona Highway Safety Program Spend on Impaired Driving?
Per Arizona Revised Statute (ARS) 28-1381, it is unlawful for any person under the influence of any drugs or intoxicating liquor to drive or be in “actual physical control” of a vehicle. Actual physical control encapsulates a number of factors meant to determine whether a motorist’s imminent or current actions pose a threat to themselves or others. Some of the criteria used to judge whether a driver was in actual physical control are: whether the vehicle was running, where the ignition key was located, whether the person was awake or asleep, and where the vehicle was stopped.
There are multiple types of DUI in Arizona, all of which can potentially lead to jail time and the suspension of driving privileges. Depending on the extenuating circumstances, a driver may be charged with:
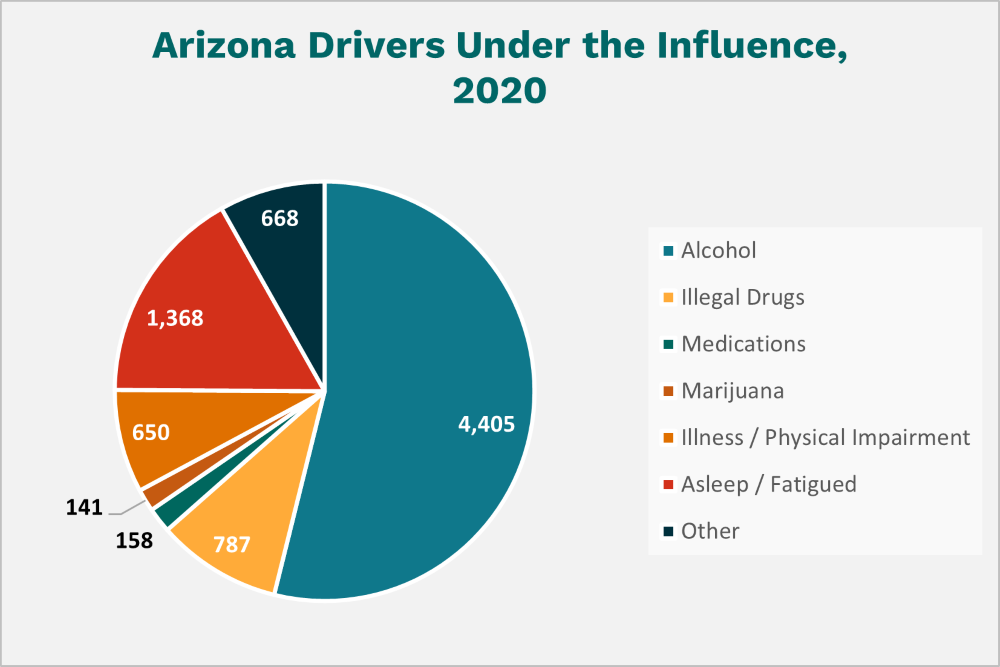
In 2020, investigations into 161,919 of Arizona’s 189,672 annual motor vehicle accidents determined that the driver(s) involved were under “no apparent influence.” For an additional 19,576 drivers, it was not determined whether they were influenced by any physical or mental factors. The breakdown of the remaining 8,177 drivers, where the motorist was confirmed to be under some form of influence, is in the graph below.
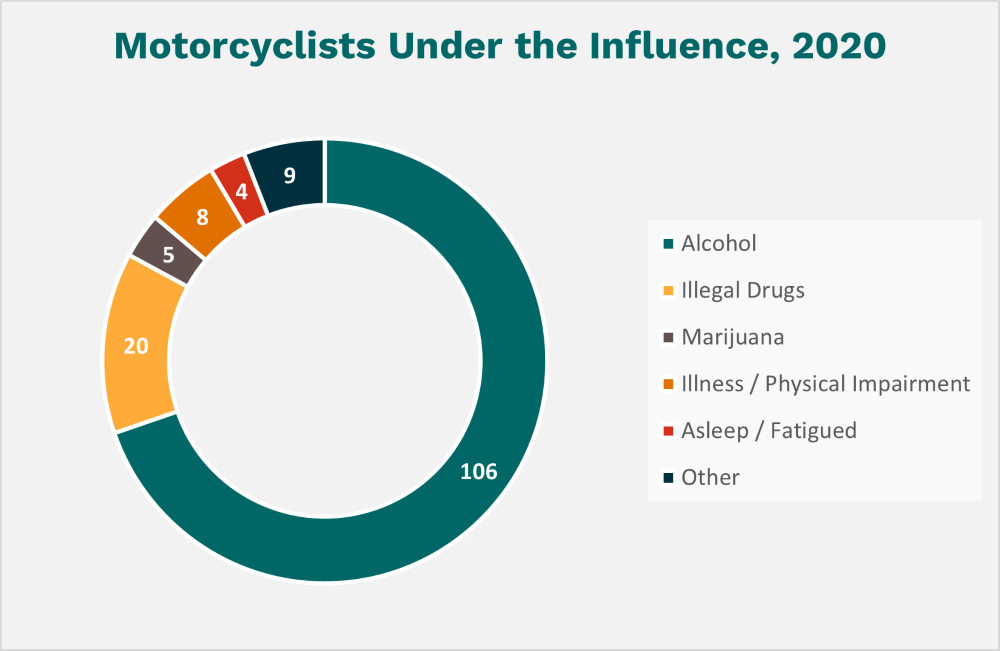
In addition to breaking down the physical status and state of mind of drivers involved in Arizona motor vehicle crashes in 2020, we dug into similar statistics for motorcyclists. Similar to drivers, most motorcyclists were either under no apparent influence (1,905) or the circumstances of the crash were unknown (316). However, 152 of 2,373 bikers were found to have been influenced by a substance or physical ailment at the site of a crash. 40 fatalities occurred from these 153 instances. The graph below details the number of motorcyclists impacted by a particular condition in the direct aftermath of a crash.
A significant number of drivers and motorcyclists under the influence in Arizona in 2020 were affected by alcohol in their system. We reviewed data on alcohol-influenced crashes in the state over a five-year period from 2016-2020. From 2019 to 2020, the total number of alcohol related crashes decreased by 438 and the number of connected deaths went down by 77. However, alcohol-related accidents made up 4.56% of all Arizona crashes in 2020, which marked a 0.77% increase from 2019.
Data is from the AZDOT and involves crashes where the investigating officer indicated that a driver had been drinking an alcoholic beverage. No assumption should be made the motorist was legally intoxicated (BAC of .08 or higher) at the time of the crash.
| Year | Alcohol Related Crashes |
Percent of Crashes |
Deaths | Percent of Fatalities |
Injuries | Percent of Injuries |
|---|---|---|---|---|---|---|
| 2016 | 4,965 | 3.90% | 302 | 31.72% | 3,351 | 5.88% |
| 2017 | 4,921 | 3.85% | 325 | 32.57% | 3,181 | 5.69% |
| 2018 | 4,705 | 3.68% | 265 | 26.21% | 3,014 | 5.61% |
| 2019 | 4,944 | 3.79% | 258 | 26.33% | 2,999 | 5.55% |
| 2020 | 4,506 | 4.56% | 181 | 17.12% | 2,863 | 6.92% |
Passenger cars were involved in nearly half of Arizona’s crashes in 2020 (48.04%). It thus seems logical that they were also involved in alcohol-related crashes at a higher rate than other vehicles (54.94%). Passenger cars were involved in over three times as many “crashes causing injury” as the second-most prevalent vehicle in that category, pickup trucks.
Standard civilian vehicles were involved in most fatal alcohol-related accidents, as opposed to emergency vehicles, big rigs, and buses. 38.85% of fatal alcohol-related crashes in Arizona involved a passenger car, while station wagons and pickup trucks each amounted to 20.14% of lethal collisions.
| Motor Vehicle Type |
Total Crashes |
Percentage of Crashes |
Fatal Crashes |
Injury Crashes |
PDO Crashes |
|---|---|---|---|---|---|
| Passenger Cars | 2,420 | 54.94% | 54 | 943 | 1,423 |
| Station Wagons | 727 | 16.50% | 28 | 290 | 409 |
| Pickup Trucks | 744 | 16.89% | 28 | 312 | 404 |
| Vans | 46 | 1.04% | 2 | 20 | 24 |
| Truck Tractor | 3 | 0.07% | 0 | 3 | 0 |
| Concrete Mixer Trucks | 0 | 0 | 0 | 0 | 0 |
| Dump Trucks | 0 | 0 | 0 | 0 | 0 |
| Garbage Trucks | 0 | 0 | 0 | 0 | 0 |
| Tanker Trucks | 0 | 0 | 0 | 0 | 0 |
| Wrecker / Tow Trucks | 0 | 0 | 0 | 0 | 0 |
| Other Trucks | 140 | 3.18% | 0 | 47 | 93 |
| School Bus | 1 | 0.02% | 0 | 0 | 1 |
| Other Buses | 0 | 0 | 0 | 0 | 0 |
| Motorcycle | 106 | 2.41% | 20 | 80 | 6 |
| All-Terrain Vehicle | 20 | 0.45% | 5 | 13 | 2 |
| Golf Carts | 2 | 0.05% | 0 | 2 | 0 |
| Moped | 2 | 0.05% | 1 | 1 | 0 |
| Recreational Vehicle | 1 | 0.02% | 0 | 1 | 0 |
| Motor Home | 0 | 0 | 0 | 0 | 0 |
| Fire Trucks | 0 | 0 | 0 | 0 | 0 |
| Ambulances | 1 | 0.02% | 0 | 0 | 1 |
| Other Vehicles | 3 | 0.07% | 0 | 1 | 2 |
| Vehicle Type Unknown | 189 | 4.29% | 1 | 75 | 113 |
| Totals | 4,405 | 100.00% | 139 | 1,788 | 2,478 |
The damages from crashes and collisions where a driver was suspected to be under the influence of alcohol were extensive in 2020. In total, estimated economic damages from fatal crashes, collision injuries, and property destruction across all Arizona counties amounted to $17,193,082,878. Maricopa County (55.01%) and Pima County (13.23%) combined accounted for 68.24% of the statewide economic damages. Greenlee County, in contrast, accounted for only 0.04% of the overall sum, with no estimated fatality-related damages. The statistics are tracked by county in the chart below, with all figures being in dollars.
| County | Fatalities | Injuries | Property Damage Only |
Total |
|---|---|---|---|---|
| Apache | 228,368,904 | 36,942,187 | 2,467,080 | 267,778,171 |
| Cochise | 237,884,275 | 72,234,969 | 6,632,280 | 316,751,524 |
| Coconino | 409,160,953 | 169,203,551 | 18,711,360 | 597,075,864 |
| Gila | 218,853,533 | 87,695,516 | 6,258,480 | 312,807,529 |
| Graham | 142,730,565 | 30,505,950 | 2,338,920 | 175,575,435 |
| Greenlee | 0 | 5,722,703 | 523,320 | 6,246,023 |
| La Paz | 161,761,307 | 34,992,258 | 2,445,720 | 199,199,285 |
| Maricopa | 4,681,562,532 | 4,230,621,476 | 546,324,720 | 9,458,508,728 |
| Mohave | 532,860,776 | 229,270,174 | 19,565,760 | 781,696,710 |
| Navajo | 361,584,098 | 81,249,831 | 8,704,200 | 451,538,129 |
| Pima | 1,541,490,102 | 672,747,389 | 60,342,000 | 2,274,579,491 |
| Pinal | 570,922,260 | 281,309,447 | 24,179,520 | 876,411,227 |
| Santa Cruz | 66,607,597 | 10,149,247 | 1,783,560 | 78,540,404 |
| Yavapai | 608,983,744 | 279,750,607 | 24,179,520 | 912,913,871 |
| Yuma | 294,976,501 | 173,905,786 | 14,578,200 | 483,460,487 |
| Totals | 10,057,747,147 | 6,396,301,091 | 739,034,640 | 17,193,082,878 |
In 2020, Arizona saw 4,506 alcohol-related crashes. An “alcohol-related crash” is defined as a collision where the investigating officer indicated that a driver consumed alcoholic beverages. It should not be assumed that every driver involved in an alcohol-related crash was over the legal state BAC limit of .08. Of all Arizona counties, Maricopa had the most alcohol-related collisions, injuries, fatalities, and property damage incidents.
| County | Alcohol-Related Crashes |
Fatal Crashes |
Injury Crashes |
PDO Crashes |
Victims Killed |
Victims Injured |
|---|---|---|---|---|---|---|
| Apache | 30 | 3 | 20 | 7 | 3 | 29 |
| Cochise | 30 | 2 | 10 | 18 | 2 | 11 |
| Coconino | 159 | 7 | 76 | 76 | 8 | 109 |
| Gila | 77 | 1 | 47 | 29 | 1 | 87 |
| Graham | 29 | 3 | 12 | 14 | 5 | 27 |
| Greenlee | 2 | 0 | 1 | 1 | 0 | 3 |
| La Paz | 27 | 3 | 12 | 12 | 4 | 20 |
| Maricopa | 2,834 | 74 | 1,115 | 1,645 | 81 | 1,730 |
| Mohave | 173 | 9 | 78 | 86 | 10 | 117 |
| Navajo | 66 | 7 | 29 | 30 | 7 | 42 |
| Pima | 578 | 43 | 242 | 293 | 48 | 350 |
| Pinal | 187 | 4 | 95 | 88 | 4 | 147 |
| Santa Cruz | 9 | 0 | 4 | 5 | 0 | 5 |
| Yavapai | 193 | 5 | 88 | 100 | 6 | 117 |
| Yuma | 112 | 2 | 45 | 65 | 2 | 69 |
| Totals | 4,506 | 163 | 1,874 | 2,469 | 181 | 2,863 |
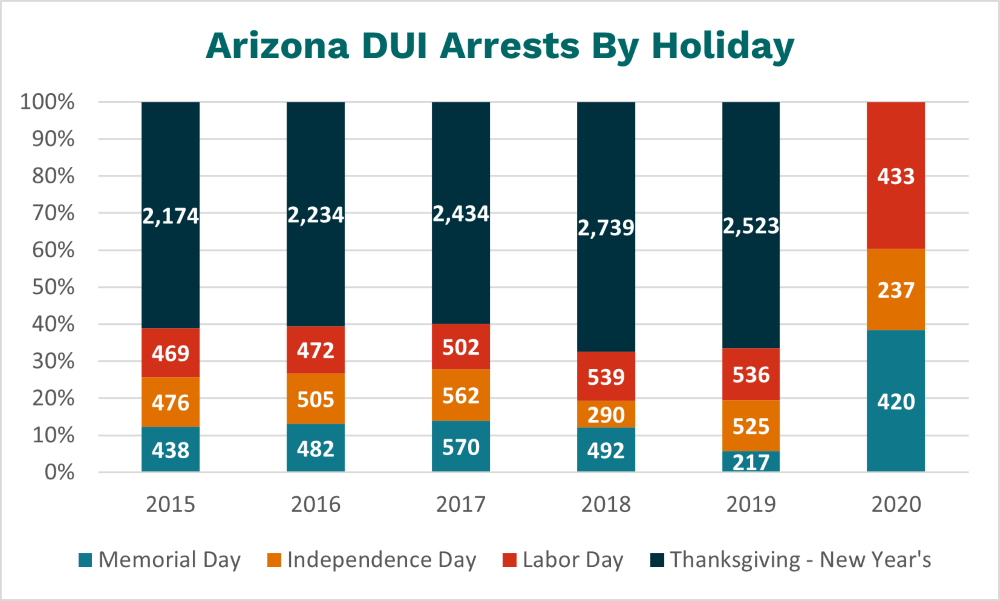
During the holiday season, there is frequently an unfortunate uptick in the number of drunk driving incidents, which increases the risk for everyone using Arizona roads. In 2019, 13.58% of the state’s 28,000 impaired driving arrests occurred on Memorial Day, Independence Day, Labor Day, or between Thanksgiving and New Year’s. To effectively combat impaired driving statewide, the Governor’s Office of Highway Safety (GOHS) provided funding for overtime enforcement, enhanced training programs for officers, and equipment.
Arizona’s DUI enforcement program revolves around two key dimensions: 1) year-round DUI recognition and enforcement and 2) enhanced enforcement campaigns aligning with holidays and major state events. The overarching goal of the GOHS is to identify areas that are disproportionately impacted by alcohol-influenced injury and fatality collisions and devote appropriate resources to those regions. DUI Task Forces and local law enforcement agencies use sobriety checkpoints and saturation patrols throughout the year, with a particular emphasis on holidays.
The result of Arizona’s strict enforcement of DUI laws during holidays is seen below. GOHS has not yet updated arrest statistics for Thanksgiving – New Year’s in 2020.
Before dropping slightly in 2019, the number of law enforcement officers in Arizona grew steadily from 2015 through 2018. Likewise, the number of people contacted over an infraction or suspected illegal activity grew over that same four-year period, before decreasing in 2019. During the five-year span, a total of 138,481 statewide DUI arrests were made. Just over 25% of these arrests were for extreme DUI, where a driver had a BAC of 0.15 or greater.
| 2015 | 2016 | 2017 | 2018 | 2019 | |
|---|---|---|---|---|---|
| Number of Officers | 54,075 | 64,234 | 74,624 | 82,818 | 82,361 |
| Number of Contacts | 1,054,247 | 1,133,840 | 1,291,989 | 1,426,651 | 1,330,198 |
| Sober Drivers Contacted | 12,760 | 9,060 | 15,723 | 19,789 | 34,243 |
| Total DUI Arrests | 27,799 | 26,082 | 27,683 | 28,094 | 28,823 |
| Aggravated DUI | 4,070 | 3,511 | 3,749 | 4,014 | 4,312 |
| Misdemeanor DUI | 23,729 | 22,571 | 23,934 | 24,080 | 24,511 |
| Extreme DUI | 7,380 | 7,135 | 6,765 | 7,197 | 6,847 |
| Under 21 DUI | 1,383 | 1,351 | 1,346 | 1,149 | 993 |
| Average BAC | 0.158 | 0.155 | 0.152 | 0.154 | 0.153 |
| Seat Belt Citations | 25,649 | 29,386 | 31,242 | 33,511 | 31,184 |
| Child Restraint Citations | 4,825 | 5,123 | 5,890 | 5,809 | 4,952 |
| Underage Consumption | 5,435 | 4,829 | 4,646 | 4,233 | 3,497 |
| DUI Drug | 5,692 | 5,030 | 7,040 | 6,680 | 7,287 |
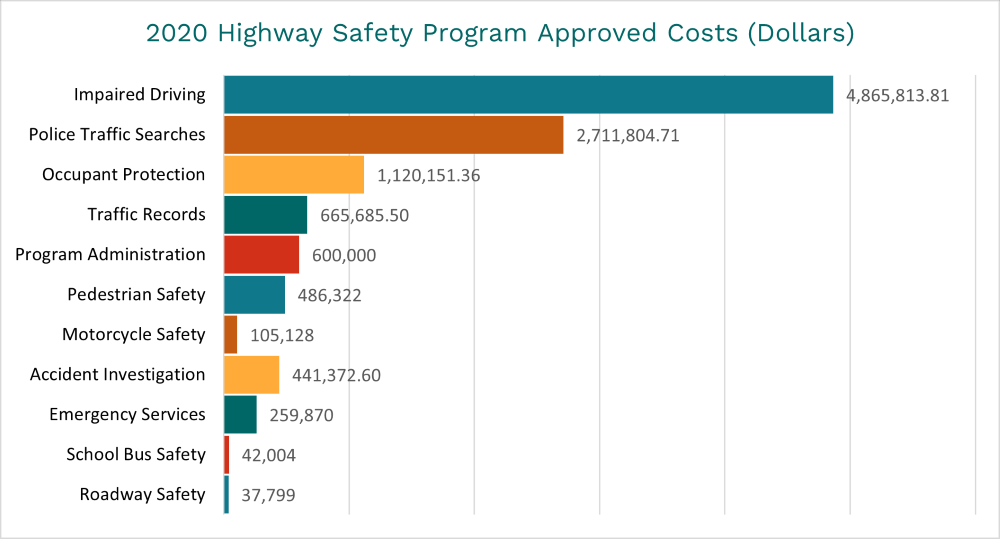
DUIs are not only dangerous to the driver and others on or near the roadway but can also necessitate millions of dollars in government spending. “Impaired driving” was by far the largest category of expenses for the Arizona Highway Safety Program in 2020. 43% of the state’s Highway Safety Program budget was allocated to this specific element of traffic safety, whereas School Bus Safety, Roadway Safety, Motorcycle Safety, and Emergency Services combined made up only 3.6%.
https://accidentdatacenter.com/us/arizona/phoenix-az/maricopa-county-az
https://azdot.gov/sites/default/files/media/2021/07/2020-crash-facts.pdf
https://www.azdps.gov/safety/impaired-driving
https://www.cdc.gov/nchs/pressroom/sosmap/accident_mortality/accident.htm